What Might Future Bond Returns Look Like?

Stock returns get all the headlines, and with US equities entering their first bear market since 2008, there is good reason for that. However, fixed income may account for a significant portion, or even a majority, of many investors’ portfolios, making bond returns just as important for those investors.

While we believe stock returns can offer similar upside to their history and that the current decline in prices will ultimately prove to be an opportunity, the same may not be true for fixed income.

As the LPL Chart of the Day shows, future long-term returns of bonds have been primarily determined by the starting yield. In other words, the coupon may be the most significant factor in your total return over the long term. Through Wednesday’s close, the Bloomberg Barclays US Aggregate Bond Index returned 4.8% year to date, following last year’s nearly 9% return. But because yields fall as bond prices rise, the yield on the benchmark bond index recently hit its lowest level ever, implying that total returns over the next 10-year period could be less than 2% annualized for fixed income based on that particular bond benchmark.

View expanded chart.

“Bonds have once again proven themselves a reliable ballast to equity market volatility,” said LPL Financial Senior Market Strategist Ryan Detrick. “However, investors may be underappreciating what the recent decline in yields means for the future of fixed income returns and an already tough search for yield.”

For more information on all our views, including why we currently rate equities “overweight” and fixed income “underweight” please view our latest Global Portfolio Strategy.

Gaining Confidence in a COVID-19 Peak

We continue to follow our Road to Recovery Playbook for help determining where the market is in its bottoming process.

Today we are making two changes. The first is to Signal #1, which we upgraded from “monitoring daily” to ”almost there.” We aren’t ready to check this one off completely, based on the latest data from Johns Hopkins, but we may be able to declare the peak with confidence over the next week (though we acknowledge a second wave cannot be ruled out).

View expanded chart.

The other change we have made is to Signal #4. Recent gains have removed oversold conditions. With stocks having just staged one of their strongest three-week rallies ever, more sellers may emerge. Measures of market internals, such as the percent of S&P 500 Index constituents stocks above their 200-day moving average at 23%, no longer reflect such intense pessimism as in late March, when this statistic fell below 5%, below the lowest levels in 2008.

Our last change to the playbook on April 3 was to downgrade Signal #3 because of the strength of the latest stock market rally—stocks are no longer pricing in a recession with the S&P 500 Index’s bear market decline of 34% having been cut in half. The S&P 500 has lost 16% since its February 19 high and 11.9% year to date through Tuesday’s close. That signal remains “Almost there.”

The last two signals remain unchanged. The historic surge in unemployment gave investors visibility into the severity of a US recession (Signal #2). Today’s retail sales report for March provided more evidence of just how deep this economic contraction will be.

Finally, the policy response from the Federal Reserve and policymakers in Washington, DC, was more than enough to check off Signal #5 in late March. But more stimulus may be on the way in the form of funds for small business, state and local governments, and the healthcare system.

With only two of our five signals now in place, we believe stocks may be ripe for a pullback. “Stocks may now be pricing in more of a V-shaped recovery, and less of the U-shape that we are likely to see,” according to LPL Equity Strategist Jeffrey Buchbinder. “We don’t know for sure if the March 23 lows will be durable, but given stocks’ tendency to retest lows after waterfall declines, a pullback from current levels seems more likely than not in the short term.”

The near-term risk-reward trade-off has become less favorable, and we think a more attractive entry point may emerge soon. However, even with the S&P 500 27% off the lows, we continue to like the opportunity for long-term investors and maintain our overweight equities recommendation.

Strategic Asset Allocation: A 3-to-5-Year Perspective of Markets

George Smith | Portfolio Strategist

Additional content provided by John Lohse, Sr. Analyst, Research.

This year, investors encounter a unique array of challenges and opportunities within the financial markets. LPL Research’s recently updated Strategic Asset Allocation (SAA) and Capital Market Assumptions (CMA) offer valuable insights for navigating this environment. The SAA was developed through an analytical combination of mind and machine that incorporates quantitative modeling with team-based input and overlay from LPL’s Strategic and Tactical Asset Allocation Committee (STAAC). We explore LPL’s strategic views on equities, fixed income, and alternative investments, providing a comprehensive overview of our recommendations for more long-term (three-to-five-year) investment strategies.

Equities

The LPL Research SAA advises paring back its overweight exposure to equities to reflect richer valuations relative to fixed income. Given that these equities valuations relative to fixed income create a more challenging risk-reward trade-off over a 3-to-5-year time horizon, we’ve implemented a neutral equity positioning relative to benchmark levels. This adjustment reflects a slightly more cautious approach given the risk-reward scenario in today’s market environment. The SAA also suggests a reduction in the underweight to large-cap equities (mostly funded by reducing mid-caps) and a smaller allocation to international equities, from previous overweight levels, emphasizing the importance of balancing risk and reward in the current market environment.

Fixed Income

In response to increasingly competitive yields relative to recent history, the LPL Research SAA recommends increasing core fixed income holdings. Core fixed income is an attractive asset class offering diversification, liquidity, and income in multi-asset portfolios. The SAA doesn’t recommend any non-core bond allocations, and removes a previous allocation to high yield bonds, as they have become less attractive, with credit spreads (that is, the yield premium relative to U.S. Treasury bonds) remaining tight relative to history. If spreads widen, amid possible deteriorating economic conditions, the value of those bonds will be negatively impacted. The interest rate sensitivity of the core bond allocations remains around neutral relative to the benchmark. Overall, with expectations of a slow growth, low-inflation macroeconomic environment, we do believe that core bonds, especially given their diversifying attributes, can play a crucial role in optimizing risk-adjusted returns within investment objectives.

Alternative Investments

The SAA includes an allocation to alternative investments, partially funded by an underweight to cash, as these lower-correlation assets may offer a valuable opportunity to navigate uncertainty and enhance portfolio resilience amidst a lower return environment. Within alternative investments, we advise a rotation towards less market-sensitive managed futures and global macro strategies. The potential for heightened volatility and cross-asset dispersion in the market underscores the importance of diversifying strategies to hedge against economic surprises and benefit from divergent trends.

The LPL Research Growth with Income (GWI) investment objective (60 stocks /40 bonds and cash) chart reflects the strategic asset allocation compared with GWI benchmark weights.

LPL Research Growth with Income (60/40) Strategic Asset Allocation
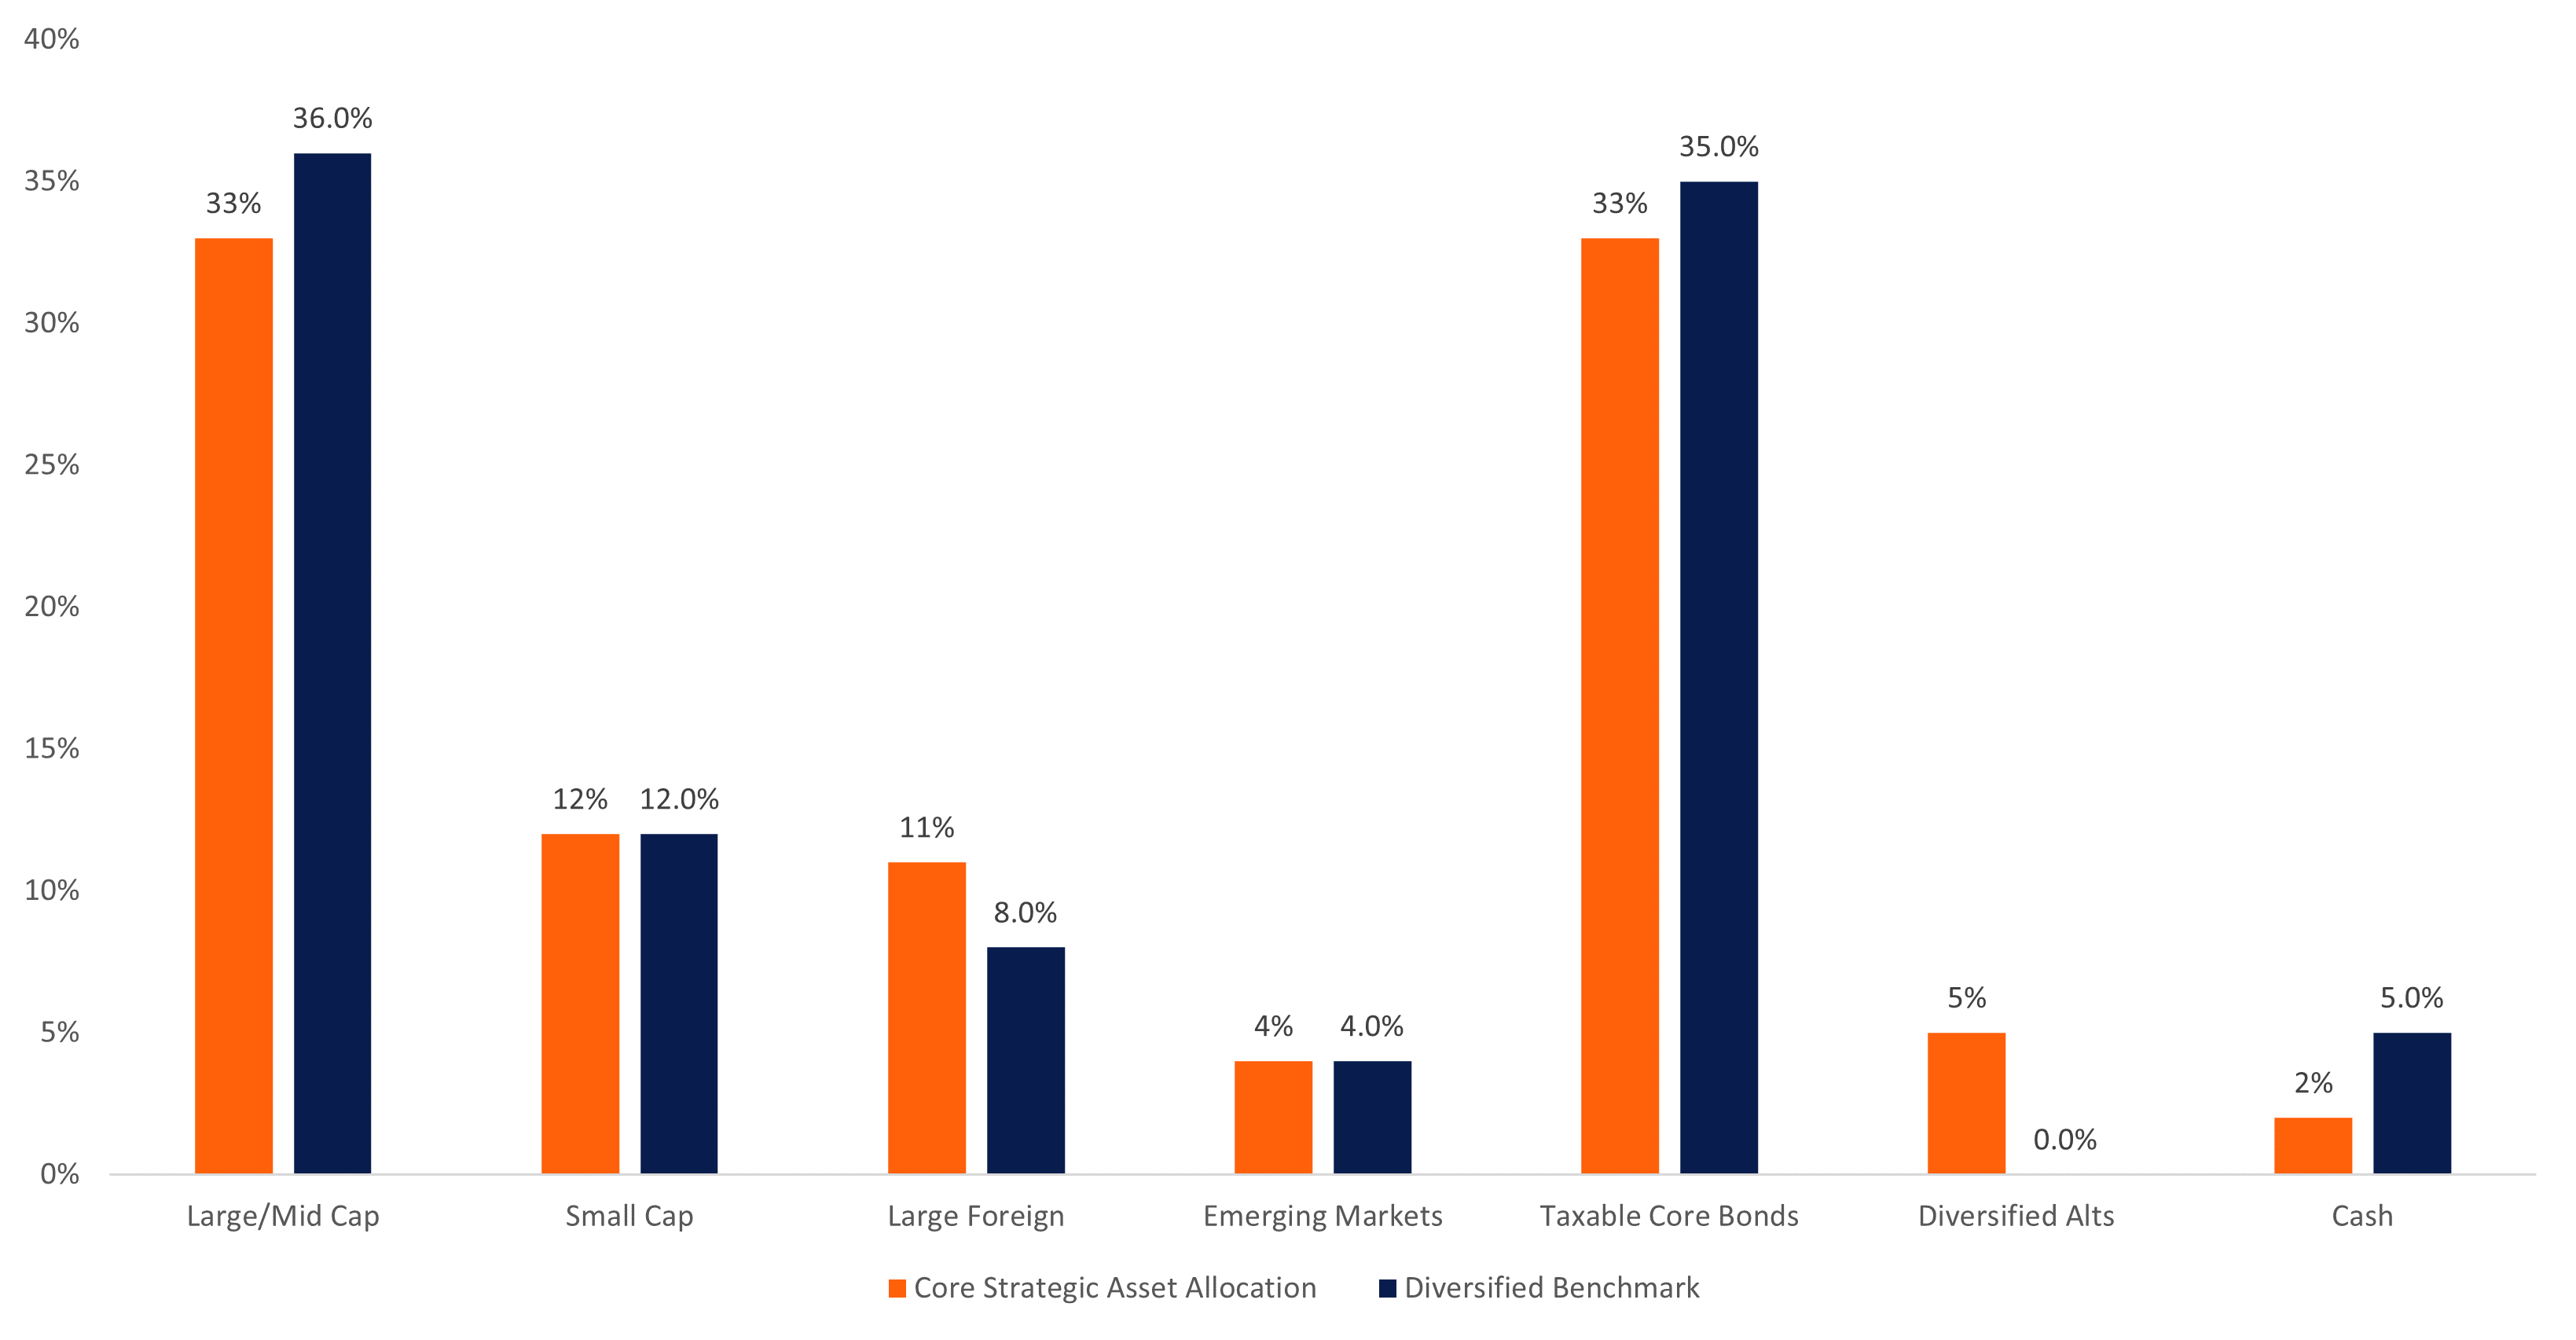
Chart depicting the LPL Research Growth with Income investment objective reflects the strategic asset allocation compared with GWI benchmark weights.
Source: LPL Research 01/19/24

Summary

LPL Research’s 2024 Strategic Asset Allocation (SAA) update focuses on reducing risk in portfolios within long-term horizons by trimming exposure to equities and increasing exposure to fixed income and alternative investments. The STAAC outlook anticipates below-average economic growth as inflation falls back to around the Federal Reserve’s inflation objective. By emphasizing core fixed income, and incorporating alternative strategies, investors can align their portfolios with LPL’s strategic market views.

How to Implement in Model Portfolios

The LPL Research model portfolio that captures our SAA most closely is the Model Wealth Portfolios (MWP) Strategic Exchange Traded Product (ETP) model. This model has over $12 billion in assets as of February 29, with over $5 billion in the Growth with Income (60/40) investment objective. It has a 12+ year track record, following its inception in December 2011. The model leverages the SAA’s three-to-five-year strategic investment guidance provided by the STAAC, using mostly passive, cost-efficient ETPs to implement those views. The model is governed by LPL Research’s Investment Process which covers STAAC Strategic views, Investment Manager Research ETP implementation selections, Model Portfolio Committee (MPC) supervision, and Risk Management Committee oversight. For more information on this model please consult your LPL Advisor.

IMPORTANT DISCLOSURES

This material is for general information only and is not intended to provide specific advice or recommendations for any individual. There is no assurance that the views or strategies discussed are suitable for all investors. To determine which investment(s) may be appropriate for you, please consult your financial professional prior to investing.

Investing involves risks including possible loss of principal. No investment strategy or risk management technique can guarantee return or eliminate risk.

Indexes are unmanaged and cannot be invested into directly. Index performance is not indicative of the performance of any investment and does not reflect fees, expenses, or sales charges. All performance referenced is historical and is no guarantee of future results.

This material was prepared by LPL Financial, LLC. All information is believed to be from reliable sources; however LPL Financial makes no representation as to its completeness or accuracy.

Unless otherwise stated LPL Financial and the third party persons and firms mentioned are not affiliates of each other and make no representation with respect to each other. Any company names noted herein are for educational purposes only and not an indication of trading intent or a solicitation of their products or services.

Asset Class Disclosures –

International investing involves special risks such as currency fluctuation and political instability and may not be suitable for all investors. These risks are often heightened for investments in emerging markets.

Bonds are subject to market and interest rate risk if sold prior to maturity.

Municipal bonds are subject and market and interest rate risk and potentially capital gains tax if sold prior to maturity. Interest income may be subject to the alternative minimum tax. Municipal bonds are federally tax-free but other state and local taxes may apply.

Preferred stock dividends are paid at the discretion of the issuing company. Preferred stocks are subject to interest rate and credit risk. They may be subject to a call features.

Alternative investments may not be suitable for all investors and involve special risks such as leveraging the investment, potential adverse market forces, regulatory changes and potentially illiquidity. The strategies employed in the management of alternative investments may accelerate the velocity of potential losses.

Mortgage backed securities are subject to credit, default, prepayment, extension, market and interest rate risk.

High yield/junk bonds (grade BB or below) are below investment grade securities, and are subject to higher interest rate, credit, and liquidity risks than those graded BBB and above. They generally should be part of a diversified portfolio for sophisticated investors.

Precious metal investing involves greater fluctuation and potential for losses.

The fast price swings of commodities will result in significant volatility in an investor’s holdings.

Securities and advisory services offered through LPL Financial, a registered investment advisor and broker-dealer. Member FINRA/SIPC.

Not Insured by FDIC/NCUA or Any Other Government Agency | Not Bank/Credit Union Deposits or Obligations | Not Bank/Credit Union Guaranteed | May Lose Value

Weekly Market Performance – May 8, 2020: Stocks Rebound Amid Challenging Economic Data

Market Blog

Index Performance – Week ending 5/8/2020:

S&P 500 Index:   3.50%

Dow Jones Industrial Average:  2.56%

Nasdaq Composite:   6.00%

Equities

US equities exhibited strength this week, as the S&P 500 Index climbed higher and cut year-to-date losses to under 10%. The gains came despite the Friday release of the April jobs report, which showed the unemployment rate rising to a level not previously seen in the post-war economy.

“This recession is unique, but that might not be all bad news,” said LPL Financial Senior Market Strategist Ryan Detrick. “We’ve had to flip a switch on the economy, essentially frontloading an entire recession’s worth of damage into a couple months, creating some all-time dismal data. But that means we’ll eventually be able to flip it back on, supporting a robust recovery.”

The NASDAQ Composite, with its weighting in health care/biotech and technology names, led the market gains.  The NASDAQ has so far enjoyed a massive comeback this year, erasing the more than 20% losses experienced during February and March and now sports a positive year-to-date return. Small caps outperformed on the week, but the Russell 2000 remains more than 20% below its February highs.

Growth stocks led value by a wide margin, though the leading sectors were energy and technology, which both gained approximately 6%. This is the third consecutive week of leadership for energy stocks. Utilities lagged and was the only sector lower on the week.

Is the Infrastructure Plan a Catalyst for Lower Muni Yields?

Market Blog Posted by lplresearch

Tuesday, September 28, 2021

The municipal market continues to be a relative bright spot for core fixed income investors. While most of the other “safe” parts of the core fixed income universe have generated negative returns this year, the national muni market is up for the year (through September 24). With state and local governments flush with cash due to better-than-expected tax receipts along with generous amounts of federal aid, many municipalities are in good shape. Moreover, a combination of increased demand due to an expectation of higher individual tax rates and a dearth of new issuance over the summer months have kept muni bond prices largely range bound. Now, there is a question of whether the upcoming infrastructure legislation can provide additional support to the investment-grade municipal market.

“If passed, the infrastructure bill will likely help muni credit fundamentals,” noted LPL Financial Fixed Income Strategist Lawrence Gillum. “But current valuations likely reflect the slimmed down proposal. As such, we don’t think the legislation, when passed, will be market moving”

In August, the Senate passed a $1 trillion, bipartisan infrastructure proposal that would increase new spending towards transportation and “other infrastructure” initiatives by $550 billion, spread out over five years. Roughly $340 billion would flow to municipal issuers. Importantly, the deal calls for investing $110 billion in roads, bridges and major infrastructure projects and $40 billion for bridge repair, replacement, and rehabilitation. Additionally, the bill would invest $65 billion to rebuild the electric grid and $55 billion to upgrade water infrastructure. The House of Representatives is set to consider the plan this week, with a vote scheduled for Thursday. If passed, the Infrastructure Investment and Jobs Act would mark the largest federal investment in more than 10 years.

Additional federal dollars allocated to transportation, electric utility, and water municipal sectors should be supportive of municipal valuations. However, the significantly slimmed down bill won’t be nearly as supportive to the municipal market as was expected earlier in the year. As such, we’ve seen a slight repricing in muni credit over the past few months. As seen in the LPL Research Chart of the Day, yields on municipal credit bonds, across the credit quality spectrum, have fallen this year but have recently risen. The back-up in yields since August likely represents the significant reduction in infrastructure spending as well as the uncertainty surrounding the timing of the legislation passing. President Biden’s original proposal was for $2.3 trillion so the additional $550 billion in new infrastructure spending has likely already been priced in.

Additionally, complicating the House’s ability to vote on the smaller bipartisan infrastructure plan is the larger $3.5 trillion reconciliation bill that some Democrats want to pass before the infrastructure plan is considered and vice versa. Progressive House Democrats have said they won’t vote on the infrastructure bill until the reconciliation bill passes, and moderate Democrats have said they won’t vote on a reconciliation bill unless the infrastructure bill passes. While we think the infrastructure bill ultimately passes, it’s unlikely going to be a catalyst for lower yields/higher prices but it could be another reason yields remain range bound. Moreover, with the economy continuing to recover and the prospects for higher tax rates, muni investment-grade credit should continue to perform well.

View enlarged chart.

IMPORTANT DISCLOSURES

This material is for general information only and is not intended to provide specific advice or recommendations for any individual. There is no assurance that the views or strategies discussed are suitable for all investors or will yield positive outcomes. Investing involves risks including possible loss of principal. Any economic forecasts set forth may not develop as predicted and are subject to change.

References to markets, asset classes, and sectors are generally regarding the corresponding market index. Indexes are unmanaged statistical composites and cannot be invested into directly. Index performance is not indicative of the performance of any investment and do not reflect fees, expenses, or sales charges. All performance referenced is historical and is no guarantee of future results.

Any company names noted herein are for educational purposes only and not an indication of trading intent or a solicitation of their products or services. LPL Financial doesn’t provide research on individual equities. All information is believed to be from reliable sources; however, LPL Financial makes no representation as to its completeness or accuracy.

All index and market data from FactSet and MarketWatch.

This Research material was prepared by LPL Financial, LLC.

Securities and advisory services offered through LPL Financial (LPL), a registered investment advisor and broker-dealer (member FINRA/SIPC).

Insurance products are offered through LPL or its licensed affiliates.  To the extent you are receiving investment advice from a separately registered independent investment advisor that is not an LPL affiliate, please note LPL makes no representation with respect to such entity.

  • Not Insured by FDIC/NCUA or Any Other Government Agency
  • Not Bank/Credit Union Guaranteed
  • Not Bank/Credit Union Deposits or Obligations
  • May Lose Value

MANAGING VOLATILITY

Jeffrey Roach, PhD, Chief Economist, LPL Financial

Jeffrey Buchbinder, CFA, Equity Strategist, LPL Financial
Lawrence Gillum, CFA, Fixed Income Strategist, LPL Financial

Tuesday Fixed Income Quick Takes

Posted by Lawrence Gillum, CFA, Chief Fixed Income Strategist

Tuesday, May 23, 2023

  • U.S. Treasury yields are generally higher over the past week with the two-year trading around 4.4%. The 0.50% increase in the two-year yield since last Monday is largely due to markets pricing out rate cuts later this year. Our view was that the market was too optimistic for the amount of rate cuts being priced in. Markets now expect one cut this year, which may still be too optimistic, unless financial conditions deteriorate. That said, we think we’re close to the end of the recent rise in Treasury yields.

View enlarged chart

  • News reports suggested there was “optimism” surrounding the debt ceiling negotiations but still no deal. Treasury market pricing suggests the greatest risk of delayed payment will occur for those securities that mature on or after June 6. Currently, the Treasury Department has around $60 billion in its operating cash account. For context, the Treasury’s cash balance got to around $11 billion in 2011. Our base case remains a deal gets done in time, but the clock is ticking.

View enlarged chart

  • Moreover, the Treasury Bill (T-bill) market is fairly disjointed currently with T-bills that mature on May 30 yielding 2.89% (the fed funds rate is 5.25%) and those that mature in June 8 yielding 5.81%. The difference in yields between the two securities is at extreme levels as more market participants are avoiding those securities that could be negatively impacted by a delay payment from the Treasury. The longer the negotiations drag out, the more it is likely we’ll continue to see higher yields for the securities maturing in June.

View enlarged chart

  • Interest rate volatility (as per the MOVE index) remains elevated relative to the last decade but in line with the periods before central banks’ quantitative easing. We think interest rate volatility will remain elevated as long as the Federal Reserve (Fed) remains committed to reducing the size of its balance sheet. The most interest rate sensitive fixed income assets are likely at higher risk of volatility. But buy and hold investors should remember that bonds pay back principal at par regardless of intra-period volatility.

View enlarged chart

  • After the recent back-up in yields, core fixed income sectors are trading close to levels last seen in early March and above longer-term averages. We think the risk/reward is more favorable for core bond sectors over plus sectors with the exception of the preferred securities market. As such, we think the recent move higher in yields is an attractive opportunity for investors to add to high quality fixed income.

View enlarged chart

IMPORTANT DISCLOSURES

This material is for general information only and is not intended to provide specific advice or recommendations for any individual. There is no assurance that the views or strategies discussed are suitable for all investors. To determine which investment(s) may be appropriate for you, please consult your financial professional prior to investing.

Investing involves risks including possible loss of principal. No investment strategy or risk management technique can guarantee return or eliminate risk in all market environments. For more information on the risks associated with the strategies and product types discussed please visit https://lplresearch.com/Risks  

References to markets, asset classes, and sectors are generally regarding the corresponding market index. Indexes are unmanaged statistical composites and cannot be invested into directly. Index performance is not indicative of the performance of any investment and do not reflect fees, expenses, or sales charges. All performance referenced is historical and is no guarantee of future results.

Unless otherwise stated LPL Financial and the third party persons and firms mentioned are not affiliates of each other and make no representation with respect to each other. Any company names noted herein are for educational purposes only and not an indication of trading intent or a solicitation of their products or services.

All information is believed to be from reliable sources; however, LPL Financial makes no representation as to its completeness or accuracy.

For a list of descriptions of the indexes and economic terms referenced in this publication, please visit our website at lplresearch.com/definitions.

Securities and advisory services offered through LPL Financial, a registered investment advisor and broker-dealer. Member FINRA/SIPC.

Insurance products are offered through LPL or its licensed affiliates.  To the extent you are receiving investment advice from a separately registered independent investment advisor that is not an LPL affiliate, please note LPL makes no representation with respect to such entity.

  • Not Insured by FDIC/NCUA or Any Other Government Agency
  • Not Bank/Credit Union Guaranteed
  • Not Bank/Credit Union Deposits or Obligations
  • May Lose Value