Tuesday Fixed Income Quick Takes

Posted by Lawrence Gillum, CFA, Chief Fixed Income Strategist

Tuesday, May 23, 2023

  • U.S. Treasury yields are generally higher over the past week with the two-year trading around 4.4%. The 0.50% increase in the two-year yield since last Monday is largely due to markets pricing out rate cuts later this year. Our view was that the market was too optimistic for the amount of rate cuts being priced in. Markets now expect one cut this year, which may still be too optimistic, unless financial conditions deteriorate. That said, we think we’re close to the end of the recent rise in Treasury yields.

View enlarged chart

  • News reports suggested there was “optimism” surrounding the debt ceiling negotiations but still no deal. Treasury market pricing suggests the greatest risk of delayed payment will occur for those securities that mature on or after June 6. Currently, the Treasury Department has around $60 billion in its operating cash account. For context, the Treasury’s cash balance got to around $11 billion in 2011. Our base case remains a deal gets done in time, but the clock is ticking.

View enlarged chart

  • Moreover, the Treasury Bill (T-bill) market is fairly disjointed currently with T-bills that mature on May 30 yielding 2.89% (the fed funds rate is 5.25%) and those that mature in June 8 yielding 5.81%. The difference in yields between the two securities is at extreme levels as more market participants are avoiding those securities that could be negatively impacted by a delay payment from the Treasury. The longer the negotiations drag out, the more it is likely we’ll continue to see higher yields for the securities maturing in June.

View enlarged chart

  • Interest rate volatility (as per the MOVE index) remains elevated relative to the last decade but in line with the periods before central banks’ quantitative easing. We think interest rate volatility will remain elevated as long as the Federal Reserve (Fed) remains committed to reducing the size of its balance sheet. The most interest rate sensitive fixed income assets are likely at higher risk of volatility. But buy and hold investors should remember that bonds pay back principal at par regardless of intra-period volatility.

View enlarged chart

  • After the recent back-up in yields, core fixed income sectors are trading close to levels last seen in early March and above longer-term averages. We think the risk/reward is more favorable for core bond sectors over plus sectors with the exception of the preferred securities market. As such, we think the recent move higher in yields is an attractive opportunity for investors to add to high quality fixed income.

View enlarged chart

IMPORTANT DISCLOSURES

This material is for general information only and is not intended to provide specific advice or recommendations for any individual. There is no assurance that the views or strategies discussed are suitable for all investors. To determine which investment(s) may be appropriate for you, please consult your financial professional prior to investing.

Investing involves risks including possible loss of principal. No investment strategy or risk management technique can guarantee return or eliminate risk in all market environments. For more information on the risks associated with the strategies and product types discussed please visit https://lplresearch.com/Risks  

References to markets, asset classes, and sectors are generally regarding the corresponding market index. Indexes are unmanaged statistical composites and cannot be invested into directly. Index performance is not indicative of the performance of any investment and do not reflect fees, expenses, or sales charges. All performance referenced is historical and is no guarantee of future results.

Unless otherwise stated LPL Financial and the third party persons and firms mentioned are not affiliates of each other and make no representation with respect to each other. Any company names noted herein are for educational purposes only and not an indication of trading intent or a solicitation of their products or services.

All information is believed to be from reliable sources; however, LPL Financial makes no representation as to its completeness or accuracy.

For a list of descriptions of the indexes and economic terms referenced in this publication, please visit our website at lplresearch.com/definitions.

Securities and advisory services offered through LPL Financial, a registered investment advisor and broker-dealer. Member FINRA/SIPC.

Insurance products are offered through LPL or its licensed affiliates.  To the extent you are receiving investment advice from a separately registered independent investment advisor that is not an LPL affiliate, please note LPL makes no representation with respect to such entity.

  • Not Insured by FDIC/NCUA or Any Other Government Agency
  • Not Bank/Credit Union Guaranteed
  • Not Bank/Credit Union Deposits or Obligations
  • May Lose Value

The S&P 500 Ventures into Unchartered Territory

Jeff Buchbinder | Chief Equity Strategist

Key Takeaways

  • After over two years and 512 trading days, the S&P 500 has finally broken out above its previous high.
  • Last Friday’s close of 4,839.81 was the first day the index finished above 4,796.56 since January 3, 2022.
  • The elongated stretch between highs historically suggests above-average returns going forward.

How it Unfolded

After stumbling out of the gate to start the year, the S&P 500 has found its footing and broken out to levels never reached before. These new highs might seem a bit sweeter to equity investors considering the notably bumpy ride they endured to get here. We recently explored the historical implications of this arduous path to new highs and what it could mean for future returns. Now, we can officially timestamp the date of the record high, the 512-day duration, and its 25.5% maximum drawdown, displayed in the chart below.

Periods With at Least One Year Between New S&P 500 Highs

Date of Previous Record HighDate of New Record HighTrading Days Between HighsMaximum Drawdown12-Month Forward Return
1/11/19737/17/19801,898-48.2%7.7%
3/24/20005/30/20071,803-49.1%-8.5%
10/9/20073/28/20131,376-56.8%18.4%
11/29/19683/6/1972820-36.1%4.9%
8/2/19569/24/1958540-21.6%14.1%
1/3/20221/19/2024512-25.5%?
11/28/198011/3/1982488-27.1%14.4%
8/25/19877/26/1989485-33.5%5.3%
12/12/19619/3/1963434-28.0%13.6%
8/3/19591/27/1961375-13.9%11.3%
10/10/19831/21/1985324-14.4%17.4%
2/9/19665/4/1967310-22.2%4.6%
5/21/20157/11/2016286-14.2%13.5%
2/2/19942/14/1995260-8.9%35.9%
   Average11.7%
   Median13.5%
   Percent Positive92.3%

Source: LPL Research, Bloomberg 01/22/24
Disclosures: Past performance is no guarantee of future results. All indexes are unmanaged and can’t be invested in directly. The modern design of the S&P 500 stock index was first launched in 1957. Performance back to 1950 incorporates the performance of the predecessor index, the S&P 90.

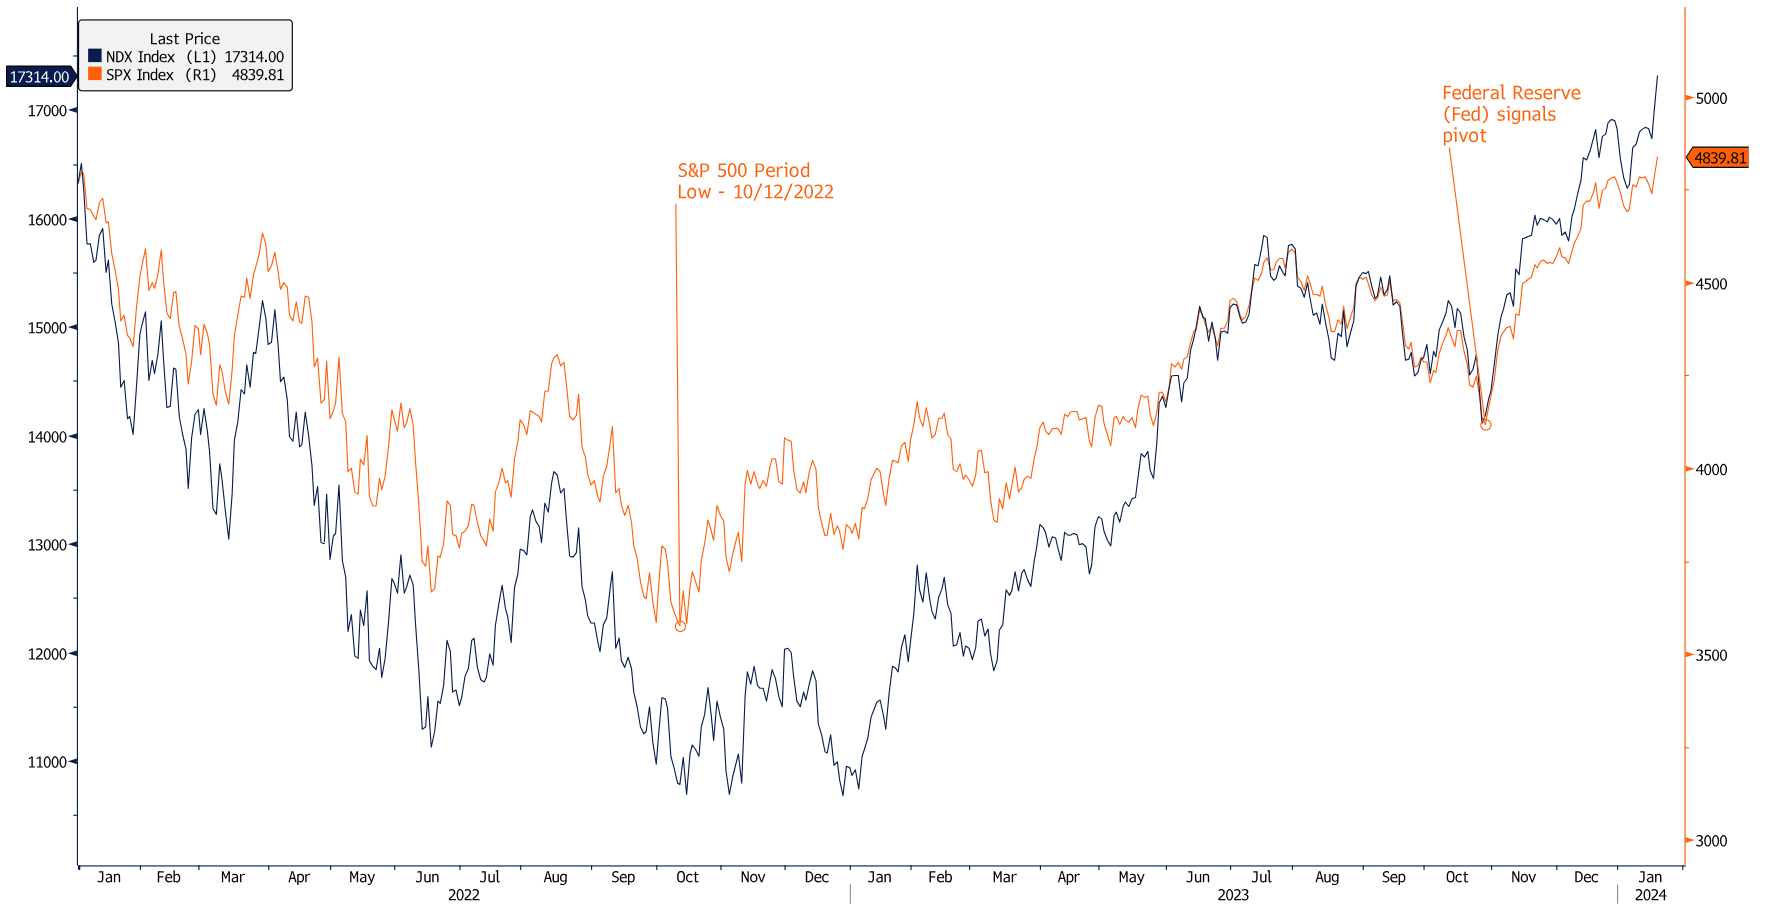
In somewhat ironic fashion, the same cohort of stocks that torpedoed the index into the 2022 doldrums were the ones that helped lift them out. Mega-cap names propelled the S&P 500’s recovery throughout 2023 and into the start of this year. From December 31, 2021, through January 19, 2024, the NASDAQ 100 Index (NDX) beat the S&P 500 (SPX) by just over 3% cumulatively (7.97% vs 4.96%). However, from the SPX low on October 12, 2022, through Friday, the NDX beat it by over 24% (62.3% to 38.1%)! The graph below highlights the NDX (left-hand side) and SPX (right-hand side) price levels from the start of 2022 through Friday.

NASDAQ 100 Pulls Down, Then Snaps Back Vs. the S&P 500

Line graph depicting returns correlation between the NASDAQ 100 and the S&P 500 as described in the preceding paragraph.
Source: LPL Research, Bloomberg 01/22/24
Disclosures: Past performance is no guarantee of future results. All indexes are unmanaged and can’t be invested in directly. The modern design of the S&P 500 stock index was first launched in 1957. Performance back to 1950 incorporates the performance of the predecessor index, the S&P 90.

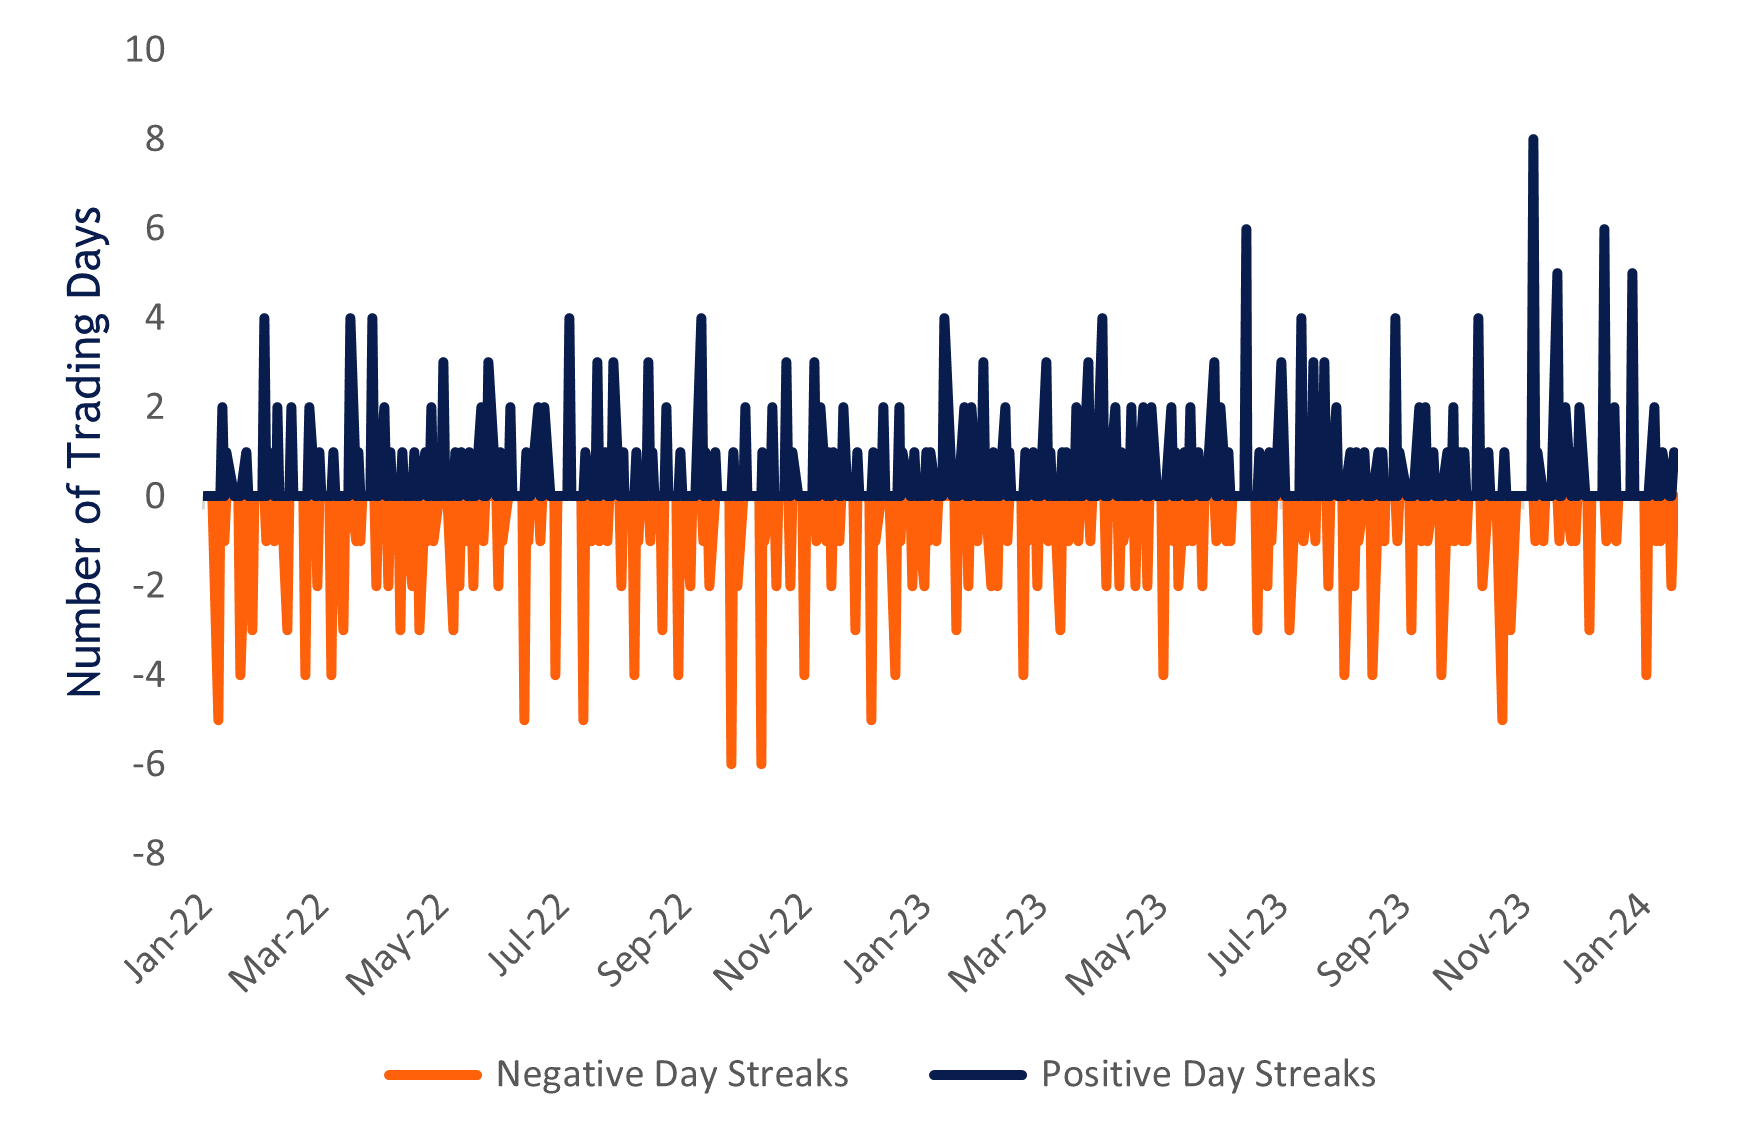
Digging into the 512-day drought for the S&P 500, we find there were 263 days of negative returns, and 249 days of positive returns. The longest consecutive daily losing streak during that period was six trading days, which happened twice, the second occurrence culminating on the October 12, 2022, low. The longest winning streak was eight trading days, which started on October 30, 2023, coinciding with the Federal Reserve (Fed) signaling a pivot on interest rate policy. The chart below illustrates the dispersion of winning and losing streaks, with marked sustained outperformance precipitating the new all-time high.

S&P 500 Pulls Together, Leading to New All-Time Highs

Bar graph depicting S&P 500 all-time high positive returns as described in the preceding paragraph.
Source: LPL Financial, Bloomberg, 01/22/24
Disclosures: Past performance is no guarantee of future results. All indexes are unmanaged and can’t be invested in directly.

Summary

While the breakout by the S&P 500 to fresh record highs is certainly welcome news, we’ll continue to keep an eye on the overall backdrop of the economy and equity markets. The fourth quarter earnings season has begun, and we expect earnings to drive the market higher from here. We forecast $235 and $250 in S&P 500 earnings per share (EPS) in 2024 and 2025, which puts a fair value range on the S&P 500 of 4,850–4,950 based on a price-to-earnings ratio between 19 and 20. LPL Research currently recommends a neutral weight to equities, an overweight to domestic versus emerging markets, an up-market cap exposure, and a tilt toward large cap growth equities.

IMPORTANT DISCLOSURES

This material is for general information only and is not intended to provide specific advice or recommendations for any individual. There is no assurance that the views or strategies discussed are suitable for all investors. To determine which investment(s) may be appropriate for you, please consult your financial professional prior to investing.

Investing involves risks including possible loss of principal. No investment strategy or risk management technique can guarantee return or eliminate risk.

Indexes are unmanaged and cannot be invested into directly. Index performance is not indicative of the performance of any investment and does not reflect fees, expenses, or sales charges. All performance referenced is historical and is no guarantee of future results.

This material was prepared by LPL Financial, LLC. All information is believed to be from reliable sources; however LPL Financial makes no representation as to its completeness or accuracy.

Unless otherwise stated LPL Financial and the third party persons and firms mentioned are not affiliates of each other and make no representation with respect to each other. Any company names noted herein are for educational purposes only and not an indication of trading intent or a solicitation of their products or services.

Asset Class Disclosures –

International investing involves special risks such as currency fluctuation and political instability and may not be suitable for all investors. These risks are often heightened for investments in emerging markets.

Bonds are subject to market and interest rate risk if sold prior to maturity.

Municipal bonds are subject and market and interest rate risk and potentially capital gains tax if sold prior to maturity. Interest income may be subject to the alternative minimum tax. Municipal bonds are federally tax-free but other state and local taxes may apply.

Preferred stock dividends are paid at the discretion of the issuing company. Preferred stocks are subject to interest rate and credit risk. They may be subject to a call features.

Alternative investments may not be suitable for all investors and involve special risks such as leveraging the investment, potential adverse market forces, regulatory changes and potentially illiquidity. The strategies employed in the management of alternative investments may accelerate the velocity of potential losses.

Mortgage backed securities are subject to credit, default, prepayment, extension, market and interest rate risk.

High yield/junk bonds (grade BB or below) are below investment grade securities, and are subject to higher interest rate, credit, and liquidity risks than those graded BBB and above. They generally should be part of a diversified portfolio for sophisticated investors.

Precious metal investing involves greater fluctuation and potential for losses.

The fast price swings of commodities will result in significant volatility in an investor’s holdings.

Securities and advisory services offered through LPL Financial, a registered investment advisor and broker-dealer. Member FINRA/SIPC.

Not Insured by FDIC/NCUA or Any Other Government Agency | Not Bank/Credit Union Deposits or Obligations | Not Bank/Credit Union Guaranteed | May Lose Value

Weekly Market Performance – May 8, 2020: Stocks Rebound Amid Challenging Economic Data

Market Blog

Index Performance – Week ending 5/8/2020:

S&P 500 Index:   3.50%

Dow Jones Industrial Average:  2.56%

Nasdaq Composite:   6.00%

Equities

US equities exhibited strength this week, as the S&P 500 Index climbed higher and cut year-to-date losses to under 10%. The gains came despite the Friday release of the April jobs report, which showed the unemployment rate rising to a level not previously seen in the post-war economy.

“This recession is unique, but that might not be all bad news,” said LPL Financial Senior Market Strategist Ryan Detrick. “We’ve had to flip a switch on the economy, essentially frontloading an entire recession’s worth of damage into a couple months, creating some all-time dismal data. But that means we’ll eventually be able to flip it back on, supporting a robust recovery.”

The NASDAQ Composite, with its weighting in health care/biotech and technology names, led the market gains.  The NASDAQ has so far enjoyed a massive comeback this year, erasing the more than 20% losses experienced during February and March and now sports a positive year-to-date return. Small caps outperformed on the week, but the Russell 2000 remains more than 20% below its February highs.

Growth stocks led value by a wide margin, though the leading sectors were energy and technology, which both gained approximately 6%. This is the third consecutive week of leadership for energy stocks. Utilities lagged and was the only sector lower on the week.

https://rc.lpl.com/content/dam/rc/documents-new/Operations/TaxReporting/LPL-2021-2022-YearEndGuide-Investor-12072021.pdf